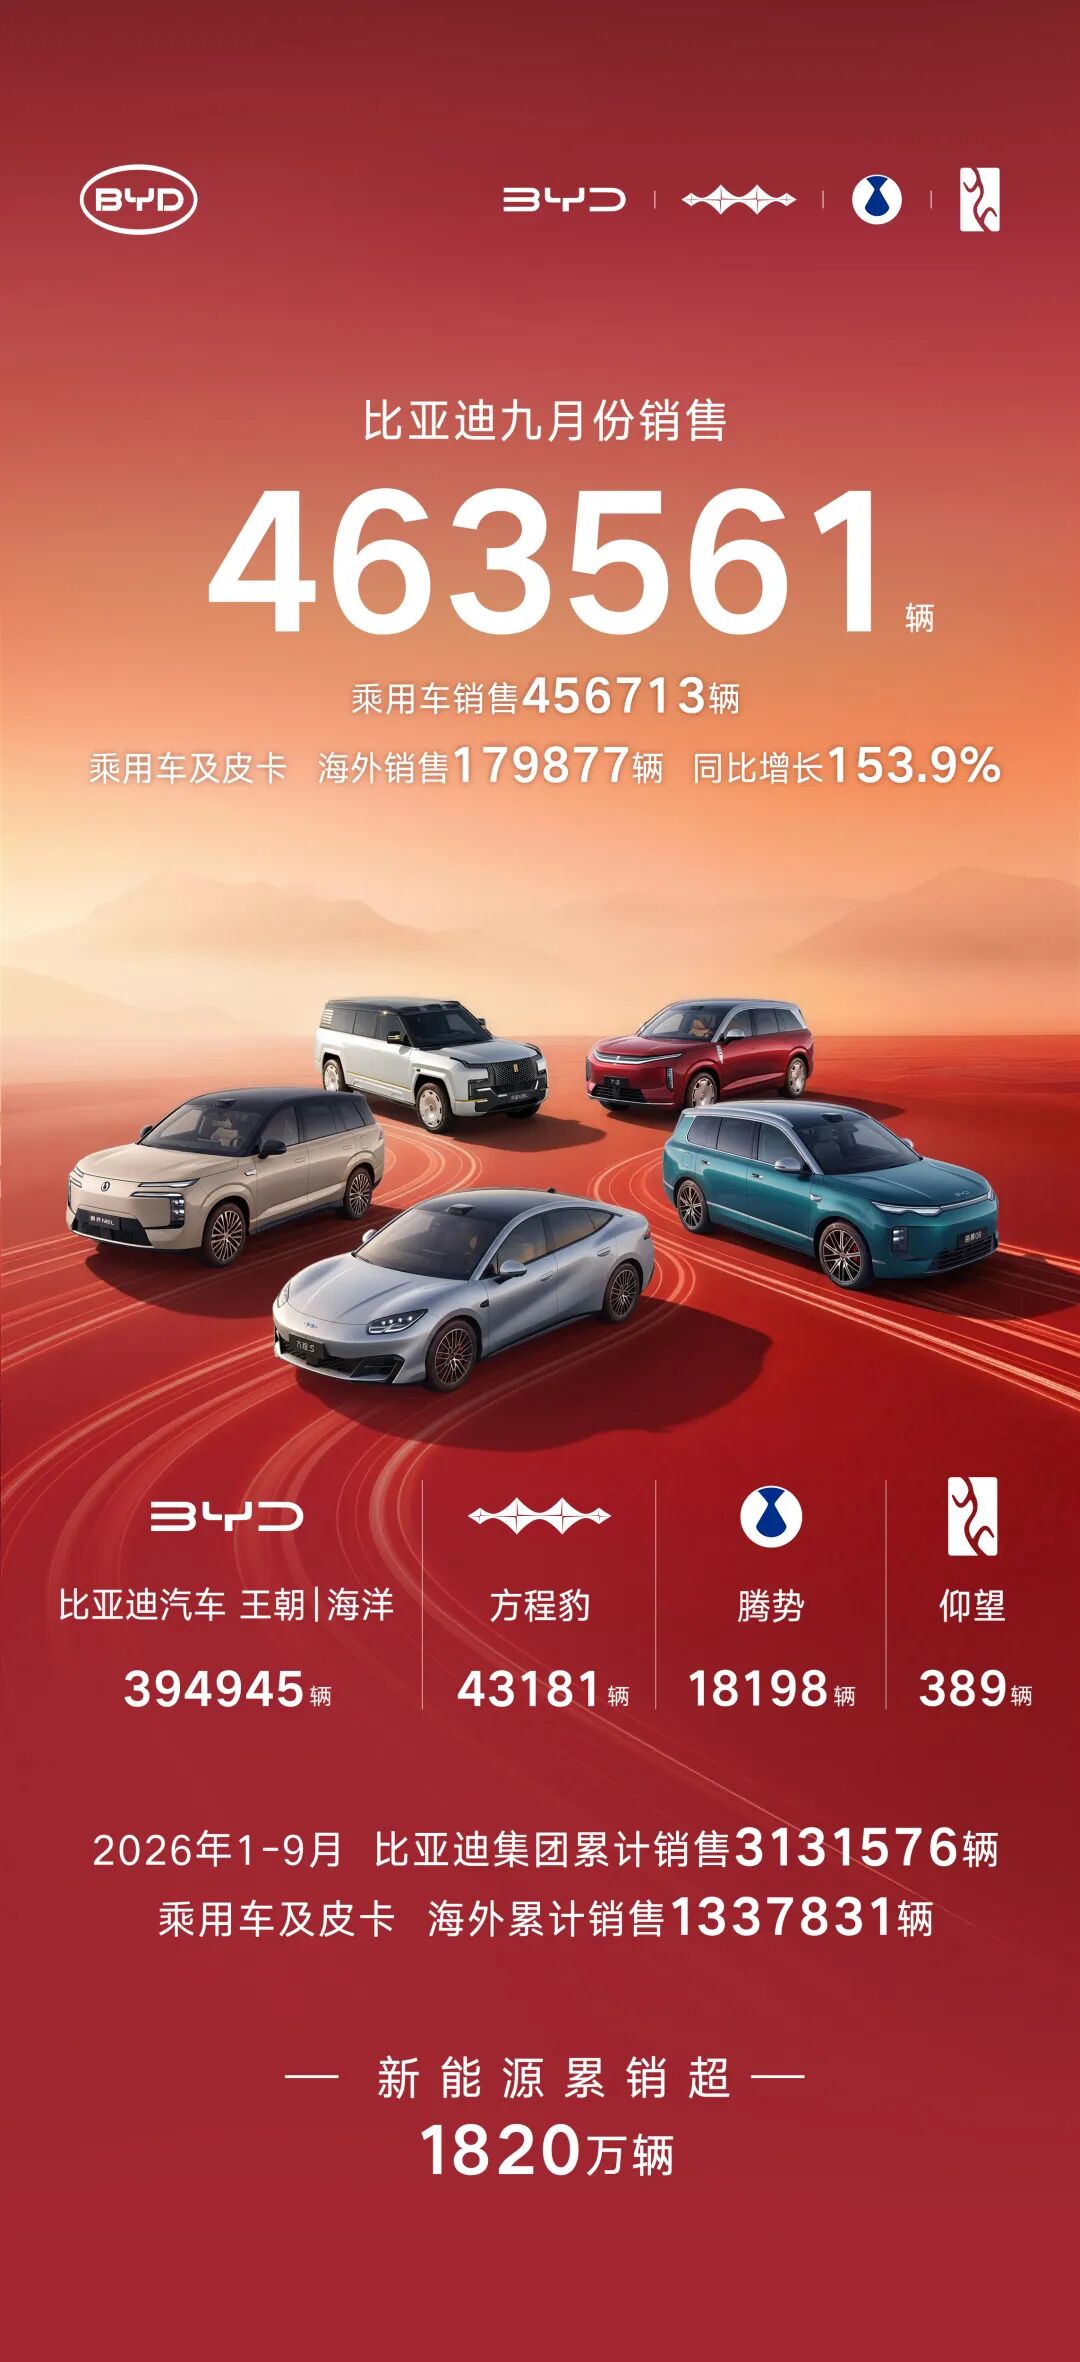
BYD's 463,561 September Deliveries: The 153.9% Overseas Surge Meets the Margin Guillotine
BYD Group moved 463,561 new vehicles in September 2026, of which 456,713 were passenger cars, according to Gasgoo data. The headline number is enormous — larger than the combined monthly output of most legacy European OEMs — but the real story sits underneath: overseas sales exploded 153.9% year-on-year. For Western investors, that single metric is both an opportunity signal and a warning flare. The company is now testing whether it can convert brutal domestic volume dominance into sustainable export margins, before trade barriers in the EU, U.S., and Turkey fully close the window.
To understand why this matters, context is essential. BYD spent 2023–2025 converting its early battery and e-platform advantages into a domestic volume machine, aided by vertical integration in LFP cells, semiconductors, and in-house motor production. That strategy worked on units but steadily compressed average selling prices. China's domestic price war, triggered in part by BYD's own aggressive cuts, pushed multiple competitors toward insolvency. Now the company is exporting that machine. The September overseas surge is not a one-month fluke — it follows a multi-quarter export ramp across Southeast Asia, Latin America, Australia, and select European markets.
Inside the September Numbers: Brand Matrix, Mix, and the Export Engine
Gasgoo's report breaks down BYD Group's 463,561 units into passenger vehicles (456,713) and commercial vehicles and other categories at the remainder. The brand matrix matters more than the consolidated figure because it reveals where margin actually lives.
- BYD main brand (Dynasty and Ocean series): The volume core. Largely LFP-based, front-wheel and rear-wheel drive architectures, priced from roughly 69,800 RMB to 250,000 RMB depending on trim. This is where domestic price compression is most acute.
- Denza: The premium joint-venture brand with Mercedes-Benz. Higher price points, more ternary NCM content in select models, and stronger export positioning in Europe and the Middle East.
- Yangwang: Ultra-premium flagship line (U8, U9). Low volume, technology-halo role. Demonstrates e4 platform and quad-motor torque vectoring.
- Fang Cheng Bao: Off-road and lifestyle segment. Bao 5 and Bao 8 compete directly with legacy body-on-frame SUVs in export markets.
For Western readers, the key structural fact is that the export surge is not evenly distributed across the brand matrix. Main-brand models, which carry lower unit margins and heavier LFP content, dominate early overseas volume, particularly in price-sensitive emerging markets. Denza and Yangwang contribute disproportionately to margin but are constrained by European tariff structures and brand-building timelines.
Domestic sales remain the majority of the September total. This matters because BYD's domestic business is fighting a margin war against Geely, Chery, Changan, and a recovering Tesla in China. Every unit sold domestically at aggressive pricing absorbs working capital and compresses group-level operating margin. The overseas surge is therefore best understood as a margin rescue operation, not a pure growth story.
LFP Dominance, the Ternary Ceiling, and What September's Mix Reveals About BYD's Export Economics
From our analysis of Shanghai and Shenzhen supply chain telemetry, BYD's product mix continues to be anchored in Lithium Iron Phosphate (LFP) chemistry, produced through its FinDreams battery subsidiary. LFP offers cost advantages, cycle-life durability, and thermal stability — but it also imposes a well-documented trade-off: lower volumetric and gravimetric energy density than high-nickel ternary (NCM/NCA) chemistries.
For domestic city cars, that trade-off is acceptable. For premium export segments in Europe, North America, and cold-climate markets, it becomes a competitive liability. LFP packs lose a meaningful share of usable range in sub-zero temperatures, and fast-charging behavior degrades more sharply than in well-managed NCM systems. This is why Denza and Yangwang models increasingly incorporate ternary or blended chemistries, and why BYD continues to invest in solid-state and high-nickel programs through its battery research arms.
The September volume alone does not tell us the chemistry split. But the export surge, concentrated in emerging markets and price-sensitive segments, suggests BYD is leveraging its LFP cost base as the primary export weapon. That is strategically rational — but it also exposes the company to margin compression when LFP pack prices fall further and when competitors match the cost structure.
On the charging side, BYD's mainstream platforms continue to support 800V architectures in select models, with peak charging rates typically quoted in the 4C–6C range for newer premium offerings. These figures should be treated as manufacturer claims unless independently validated with cycle-life data. The C-rate question is addressed more directly in the Reality Check section below.
Technical Comparison: BYD September 2026 vs. Key Global Rivals
The table below compares BYD Group's September 2026 performance and key platform characteristics against Tesla, Volkswagen Group, and Hyundai-Kia. Figures marked "not publicly disclosed" reflect data not available in the source material or standard public filings.
| Metric | BYD Group | Tesla | Volkswagen Group | Hyundai-Kia |
|---|---|---|---|---|
| September 2026 global unit sales | 463,561 (456,713 passenger) | Not publicly disclosed | Not publicly disclosed | Not publicly disclosed |
| Overseas YoY growth (Sept 2026) | +153.9% | Not publicly disclosed | Not publicly disclosed | Not publicly disclosed |
| Primary battery chemistry | LFP (dominant), NCM (premium) | NCA, LFP (Standard Range) | NCM, LFP (entry) | NCM, LFP (entry) |
| Core EV platform | e-Platform 3.0 / e4 | Model 3 / Y platform | MEB, PPE | E-GMP |
| 800V architecture availability | Select models (Denza, Yangwang) | Select models | PPE models | E-GMP (broad) |
| Domestic price-war exposure | High | Moderate | Moderate | Low (limited China retail) |
| Western tariff exposure | High (EU, U.S., Turkey) | Low-moderate | Low | Low |
Supply Chain Anatomy: Vertical Integration, Tier-1 Dependencies, and the Cost Stack
BYD's cost advantage is largely structural. The company produces its own batteries (FinDreams), power semiconductors, motors, and increasingly its own ADAS silicon and software. This vertical integration compresses the Bill of Materials (BOM) in ways that tier-1-dependent competitors cannot easily match.
Industry estimates suggest a mainstream LFP-powered BYD compact EV carries a pack-level battery cost in the range of $55–$75 per kWh as of 2025–2026, depending on chemistry, pack architecture, and cell-to-body integration. At the vehicle level, this translates to a BOM advantage of several thousand dollars versus a comparable Western OEM sourcing cells from a third party.
However, vertical integration cuts both ways. It requires enormous fixed capital, which shows up as depreciation and debt service. It also locks BYD into its own technology roadmap. If solid-state or high-nickel chemistries scale faster than expected, BYD's heavy LFP asset base becomes a strategic anchor rather than an advantage.
On the supplier side, BYD's in-house semiconductor arm supplies IGBT and SiC power modules for its own vehicles. External tier-1 dependencies are relatively limited but not zero — select ADAS sensors, high-performance compute, and certain infotainment silicon still come from third parties. For export models, local content rules in the EU and North America may force BYD to source non-Chinese tier-1 components, adding cost and complexity.
The cost structure of the September volume surge therefore depends heavily on geography. Domestic units compress margin. Export units to tariff-free or low-tariff markets carry better margin but require local distribution and service infrastructure. Export units to high-tariff markets (EU, U.S., Turkey) require either local assembly, joint ventures, or acceptance of reduced margin.
Competitive Fallout: Who Gains, Who Bleeds, and Who Watches from the Sidelines
The 153.9% overseas surge has direct competitive consequences.
- Legacy Western OEMs in emerging markets: Toyota, Volkswagen, and Stellantis face direct pressure in Southeast Asia, Latin America, and the Middle East. BYD's LFP cost base allows aggressive pricing that legacy ICE-derived platforms cannot match without margin sacrifice.
- Tesla: Direct competition in China and select export markets intensifies. Tesla's margin structure is more export-dependent and more exposed to price cuts in overlapping segments.
- Chinese competitors (Geely, Chery, NIO, XPeng): Domestic price war continues, but the export surge by BYD forces them to accelerate their own overseas strategies or cede emerging-market share.
- Hyundai-Kia: The relative winner among legacy players. Its limited exposure to the Chinese domestic retail market and strong E-GMP-based EV lineup in North America, Europe, and India positions it to defend margin while BYD focuses on price-sensitive segments.
The margin math is unforgiving. BYD's domestic price war has already compressed group-level profitability. If the overseas surge is concentrated in low-margin emerging markets, the consolidated margin picture may not improve as much as the headline volume suggests.
Reality Check: Volume Mirage, LFP Ceiling, and the Unverified Charging Claims
This is where the press release narrative meets engineering and economic reality.
The profitability paradox. A 463,561-unit month is impressive, but volume is not the same as value creation. BYD's domestic price cuts have been aggressive enough to compress industry-wide margins. The September number tells us nothing about net margin per unit, operating cash flow, or debt leverage. Investors should ask whether the overseas surge is generating positive free cash flow or simply relocating the same thin-margin model to new geographies.
The LFP technology ceiling. BYD's LFP dominance is a cost advantage, not a technology moat. LFP cannot match high-nickel ternary on energy density, cold-weather range retention, or premium fast-charging behavior. As competitors scale their own LFP production — including Tesla, CATL-dependent OEMs, and Korean cell makers — BYD's cost edge narrows. Meanwhile, in premium segments where ternary and solid-state chemistries matter, BYD remains a challenger, not the incumbent leader.
The regulatory wall. Under U.S. Section 301 tariffs, IRA FEOC rules, and EU countervailing duties, Chinese battery supply chains face severe export barriers. BYD's overseas surge is therefore concentrated in markets that either lack such barriers or where local assembly can be established. This limits the addressable margin pool and forces capital-intensive localization — which is precisely the opposite of the low-asset export model that made the surge look attractive in the first place.
The C-rate question. BYD's premium platforms have advertised fast-charging rates in the 4C–6C range and above in showcase settings. These claims require independent cycle-life validation. Megawatt-class charging propositions in particular face fundamental electrochemistry and grid-physics constraints: lithium plating, dendritic growth, and thermal runaway risks rise sharply at extreme C-rates, and local grid infrastructure often cannot deliver the required power without dedicated battery energy storage systems. Treat showcase charging figures as marketing until verified with third-party cycle-life data.
The humble version of the story: BYD is a formidable volume machine with a structural cost advantage in LFP. Whether that translates into durable profit and premium-segment competitiveness is an open question, not a settled one.
Tariffs, Trade Rules, and the Geopolitics of September's Export Surge
The regulatory landscape directly shapes BYD's export economics.
- European Union: Countervailing duties on Chinese-built EVs raise landed cost, pushing BYD toward local assembly in Hungary, Turkey, and potentially other member states. Local plants add capital intensity and reduce the margin advantage.
- United States: Section 301 tariffs and IRA FEOC rules effectively exclude Chinese-built EVs and Chinese-origin battery components from the most lucrative market. BYD's U.S. presence remains limited.
- Turkey: Additional duties on Chinese vehicles have accelerated localization discussions and joint-venture considerations.
- Emerging markets (Thailand, Brazil, Mexico, Australia, Middle East): Lower barriers, but also lower price points. Margin depends on scale, distribution efficiency, and local content rules.
The compliance strategy is strategic localization: build where you sell, source non-Chinese tier-1 components where required, and license technology where direct export is blocked. This is capital-intensive and slower than pure export, but it is the only path to durable presence in regulated markets.
Strategic Outlook: Three Scenarios for BYD's Global Expansion
Bull Case
Overseas volume continues to compound at triple-digit or high-double-digit rates. Local assembly in Hungary, Turkey, and Brazil reaches scale by 2027–2028. Denza and Yangwang establish credible premium positions in Europe and the Middle East. LFP cost leadership persists as competitors fail to match BYD's vertical integration. Group-level operating margin expands as export mix shifts toward higher-margin segments. Free cash flow turns sustainably positive.
Base Case
Overseas growth remains strong but moderates as tariffs and local content rules bite. Domestic price war continues to compress margin. Localization investments absorb capital through 2028. Premium brands gain traction slowly. Group margin stays roughly flat, with volume growth offset by mix and cost pressure. BYD remains the global unit leader but struggles to translate that into premium-segment profitability.
Bear Case
EU and U.S. barriers tighten further. Domestic price war intensifies, forcing deeper cuts. LFP chemistry advantage narrows as competitors scale. Solid-state and high-nickel breakthroughs by rivals erode BYD's technology positioning in premium segments. Localization costs balloon. Group margin compresses, debt leverage rises, and the overseas surge proves to be a margin-negative volume relocation rather than a profit engine.
Strategic Takeaways for Executives and Investors
- Track BYD's overseas revenue and gross margin by region, not just unit volume. Unit growth without margin expansion is a warning sign, not a victory.
- Monitor localization capital expenditure in Hungary, Turkey, Brazil, and Southeast Asia. These are the leading indicators of BYD's regulatory compliance strategy and long-term cost structure.
- Watch LFP pack pricing and competitor LFP scaling. BYD's cost advantage narrows as the chemistry commoditizes.
- Treat fast-charging and megawatt-charging claims as unverified until independent cycle-life data is published. Grid and battery-chemistry constraints are real.
- For Western OEMs: partnerships with Chinese suppliers can accelerate EV programs but may deepen structural dependency. Evaluate decoupled players like Hyundai-Kia as margin-defense benchmarks.
BYD's September 2026 performance is a genuine milestone. It is not, however, proof that volume equals value. The 153.9% overseas surge is the metric to watch — and the margin behind it is the question that will determine whether this is a growth story or a mirage.